Disclaimer
Information provided on this website is general in nature and does not constitute financial advice. Every effort has been made to ensure that the information provided is accurate. Individuals must not rely on this information to make a financial or investment decision. Before making any decision, we recommend you consult a financial adviser to take into account your particular investment objectives, financial situation and individual needs.
A Finsec View – Markets, China’s over-supply, Energy & more

|
Issue: 15th October 2021 |
| The inflation drums grow louder every day. This week former US Treasury Secretary Larry Summers said the US economy is overheating, and a shortage of Labor is another factor pushing up prices. He criticised the Federal Reserve’s lack of action as inflation surges. The International Monetary Fund says the global economy is entering a phase of inflationary risk, and it called on central banks to be “very, very vigilant” and take early action to tighten monetary policy if price pressures continue. (It will certainly make Governor Philip Lowe’s argument about no rate rises until 2024 harder to sustain).
Markets also had their say, with bond yields falling, indicating that perhaps there is a less immediate concern than we might think. That doesn’t mean the problem has gone away, but company earning results in the US have been positive, and there will be some solace in the fact that the growth in producer prices (PPI) seems to have stalled, albeit at very high levels. Transitory or structural? Currently, it’s a debate that will give you whiplash – we remain cautious. The Australian housing market is a source of endless barbeque conversation and media pontification. Potential first home buyers complain that they are perpetually priced out of the market. Established buyers retort that interest rates are significantly lower than when they purchased their first property. All Australians seem to concur that property prices are off the charts. In a move to help, the Australian Prudential Regulation Authority (APRA) announced last week that banks will now be expected to assess new home loan applicants at interest rates that are at least 3 percentage points higher than actual loan interest rates. This is 50 basis points higher than what the banks most commonly use and will come into play from the end of the month. The effect of this measure remains to be seen, perhaps not a massive difference for the likes of states such as South Australia; however for Sydneysiders facing median house prices of around $1.3 million (assuming a 20% deposit) that’s an additional $30,000 p.a. (after tax) they will need to justify. Meanwhile, the vaccine roll-outs are progressing steadily around the world, and in Australia finally, providing hopes of a restoration of some freedoms by Christmas. Good news indeed! |
|
Optimism remains that economies can ‘keep on, keeping on’. Critical to this and a primary focus for investors is the actions of Washington across two main issues.
Democrats have spent a huge amount of money coming out of the pandemic, and now they walk a fine line to try and get the debt ceiling extended in order to pay the bill. To do this, they will need some Republican help. Republicans, however, are taking a hard line; in their opinion, Biden’s $3.5trillion spending package is a Democrat issue and needs to be dealt with by the Democrats. In response, Treasury Secretary and former Fed Chair Janet Yellen stated in a Congressional hearing in early October that the spending package would be funded by ‘revenue measures’ (tax hikes – ouch!) and that the spending would be ‘deficit-reducing beyond the next ten years. Then, at the last minute, the House approved a bill to extend the suspension to 3 December, when Congress will have to deal with it all over again. This raises the prospect of a US government shut-down and also the prospect of the US government defaulting on its debts. Whilst this is mainly politics, it warrants attention as markets will react.
We can’t but help feel that forces are pushing the Fed closer to that taper moment. In the Northern Hemisphere, economies have been released, movement is back and the incredibly generous measures (stimulus) that got countries through COVID no longer look quite right for the economies as we find them today, i.e. economies that are broadly bubbling along quite well (sadly in Australia it is a slightly different story, but we should have our moment soon). Inside of this, we are still seeing substantial supply-side disruption, which is causing inflationary pressures – acutely obvious in energy markets (more on this later). Adding to the already elevated energy prices is Winter in the Northern Hemisphere and supply shortages post-Brexit. As a collective, it is certainly bringing the inflation conversation back to markets. Combine this with taper noise, and it may result in an anti-confidence moment that could see all assets leak a little value – We’ve seen this through September and the first half of October with bond and equity markets retreating. Turning to the domestic economy. The RBA are still a long way behind their international counterparts in normalising policy settings. With the ramping up of tapering expectations, it could ultimately put pressure on the Australian dollar. We are also seeing some geopolitical flare-ups around the likes of China, which always bodes well for a stronger US dollar. Riskier assets do not tend to like an environment in which they are not fully supported by central banks, and we expect to see a return to a quality environment. As Australia comes out of lockdown, we also expect to see a lot of volatility in the Australian data, which may affect markets (although most have probably looked through this already) and will obviously generate a lot of debate as to where we are as an economy.
|
|
| Chinese construction activity has been the single largest component in China’s incredible economic growth since the start of the 21st century. In just two decades, more than half of China’s 1.4 billion people have been ‘urbanised’ (moved from farms, villages and obsolete factory towns into hundreds of newly built cities). It has been the largest mass migration in human history.
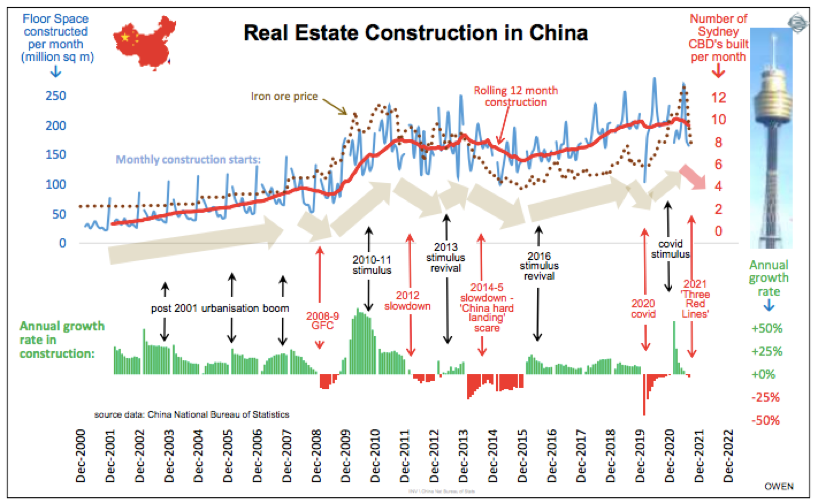
But, while construction has continued on a seemingly never-ending upward march (with developers completely reliant on high growth rates forever), urbanisation has now slowed, and the demographic realities -a consequence that began with Deng Xiaoping’s ‘one-child policy’ – are changing. Today, construction is running well ahead of demand. Many have tried to estimate the extent of China’s over-supply, but it appears there may be up to some 90 million units – either completed and vacant, or un-completed and abandoned by failed property developers. According to the Financial Times, that’s enough to house the total population of France, Germany, Italy, the UK and Canada. In China, it is also a story of growth by debt, with property developers sitting on $2.8 trillion of borrowing. The existence of this debt turns the issue of over-supply from a mild headache (lower prices and returns) into a potential financial migraine (fire sales and price collapses causing bankruptcies for highly geared developers, lenders and buyers). The cycle As our chart of the week depicts, China’s journey has included several cycles of construction slowdown and stimulus reboots:
We are now into the 5th slowdown phase. As a part of Xi Jinping campaign to purge China of capitalist excesses, since early 2021, property developers have been subject to harsh government-imposed leverage limits – known as the ‘Three Red Lines’. This sudden and fairly savage crackdown on developers has triggered a rapid contraction in construction. Thousands of developers are unable to borrow more to pay workers and suppliers to complete their projects so they can collect payments from purchasers. Households have parked their savings in real estate partly because other assets offer a poor return. Households’ spending on unfinished property accounts for half of developers’ funding. Local governments, especially outside the big cities, depend on land sales and property development to generate revenue. There is now mounting pressure for more stimulus and support to avoid a potential domino effect of collapses of highly-leveraged property developers. As Chinese construction cycles are the biggest driver of commodities prices, export revenues, mining company profits and dividends, how this story will play out is dominating headlines and rattling markets in recent weeks (driven by Evergrande, one of the world’s biggest and most indebted property companies – our Evergrande views can be found here). As we have discussed before, Chinese construction cannot continue on its upward march forever. Urbanisation has slowed, infrastructure returns are declining and the effects of a shrinking workforce and growing numbers of aged dependents are imminent. Whilst the Chinese government is unlikely to let the likes of Evergrande fail, it is highly likely they will continue to pump the brakes on the property construction boom. After 40 years of breakneck expansion, the world is completely unfamiliar with what a sustained slowdown in China will impose, but it might just be our new reality…
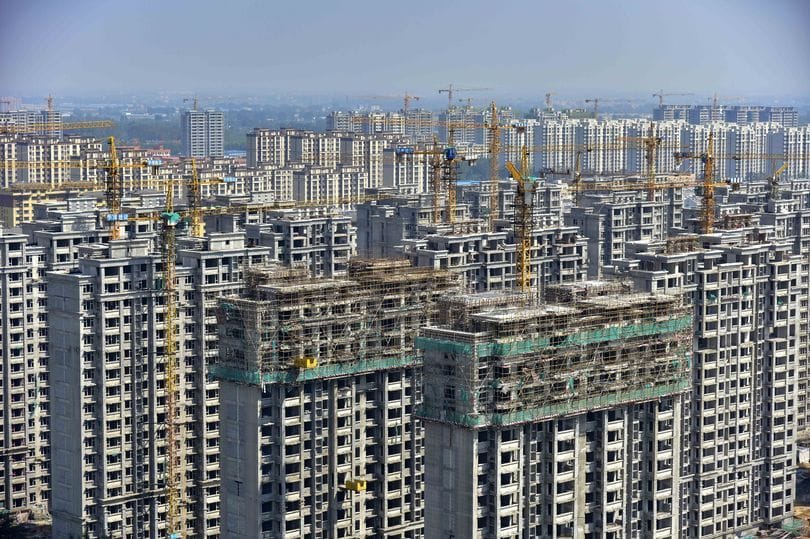
Picture: QINGZHOU, CHINA – 15 SEPTEMBER, 2021 – Real estate under construction in Qingzhou City, East China’s Shandong Province, 15 September, 2021 |
|
| As Chinese construction activity is so critical for Australian investors and Australia’s prosperity as a whole, we track it closely.
Our chart of the week comes from Ashley Owen, Chief Investment Officer at Stanford Brown. It shows Chinese construction since 2001 when China joined the World Trade Organisation, effectively accelerating its urbanisation, industrialisation and export booms. In the upper section, the blue line shows monthly construction, with the red line depicting the 12-month average rate in millions of square metres per month. The red scale to the right shows construction rising from a little over 1 Sydney CBD per month initially to around 10 Sydney CBDs per month in recent years. The rate of building activity has been increasing over time, but as previously mentioned, there have been several cyclical slowdowns and stimulus reboots along the way. The chart also shows iron ore prices (brown dots) which follow the ups and downs in construction activity. (The exception to this pattern was the iron ore price spike in 2019-20 after the Vale mine disaster and then covid lockdowns taking Brazil out of the market).
|
|
| Continuing with the China-construction theme, this video is an example of 15 abandoned apartment blocks being blown up after the bankruptcy of a Chinese developer and numerous failed government revival attempts. These apartment buildings sat unfinished for 8 years – demolition took a whole of 45 seconds.
|

|
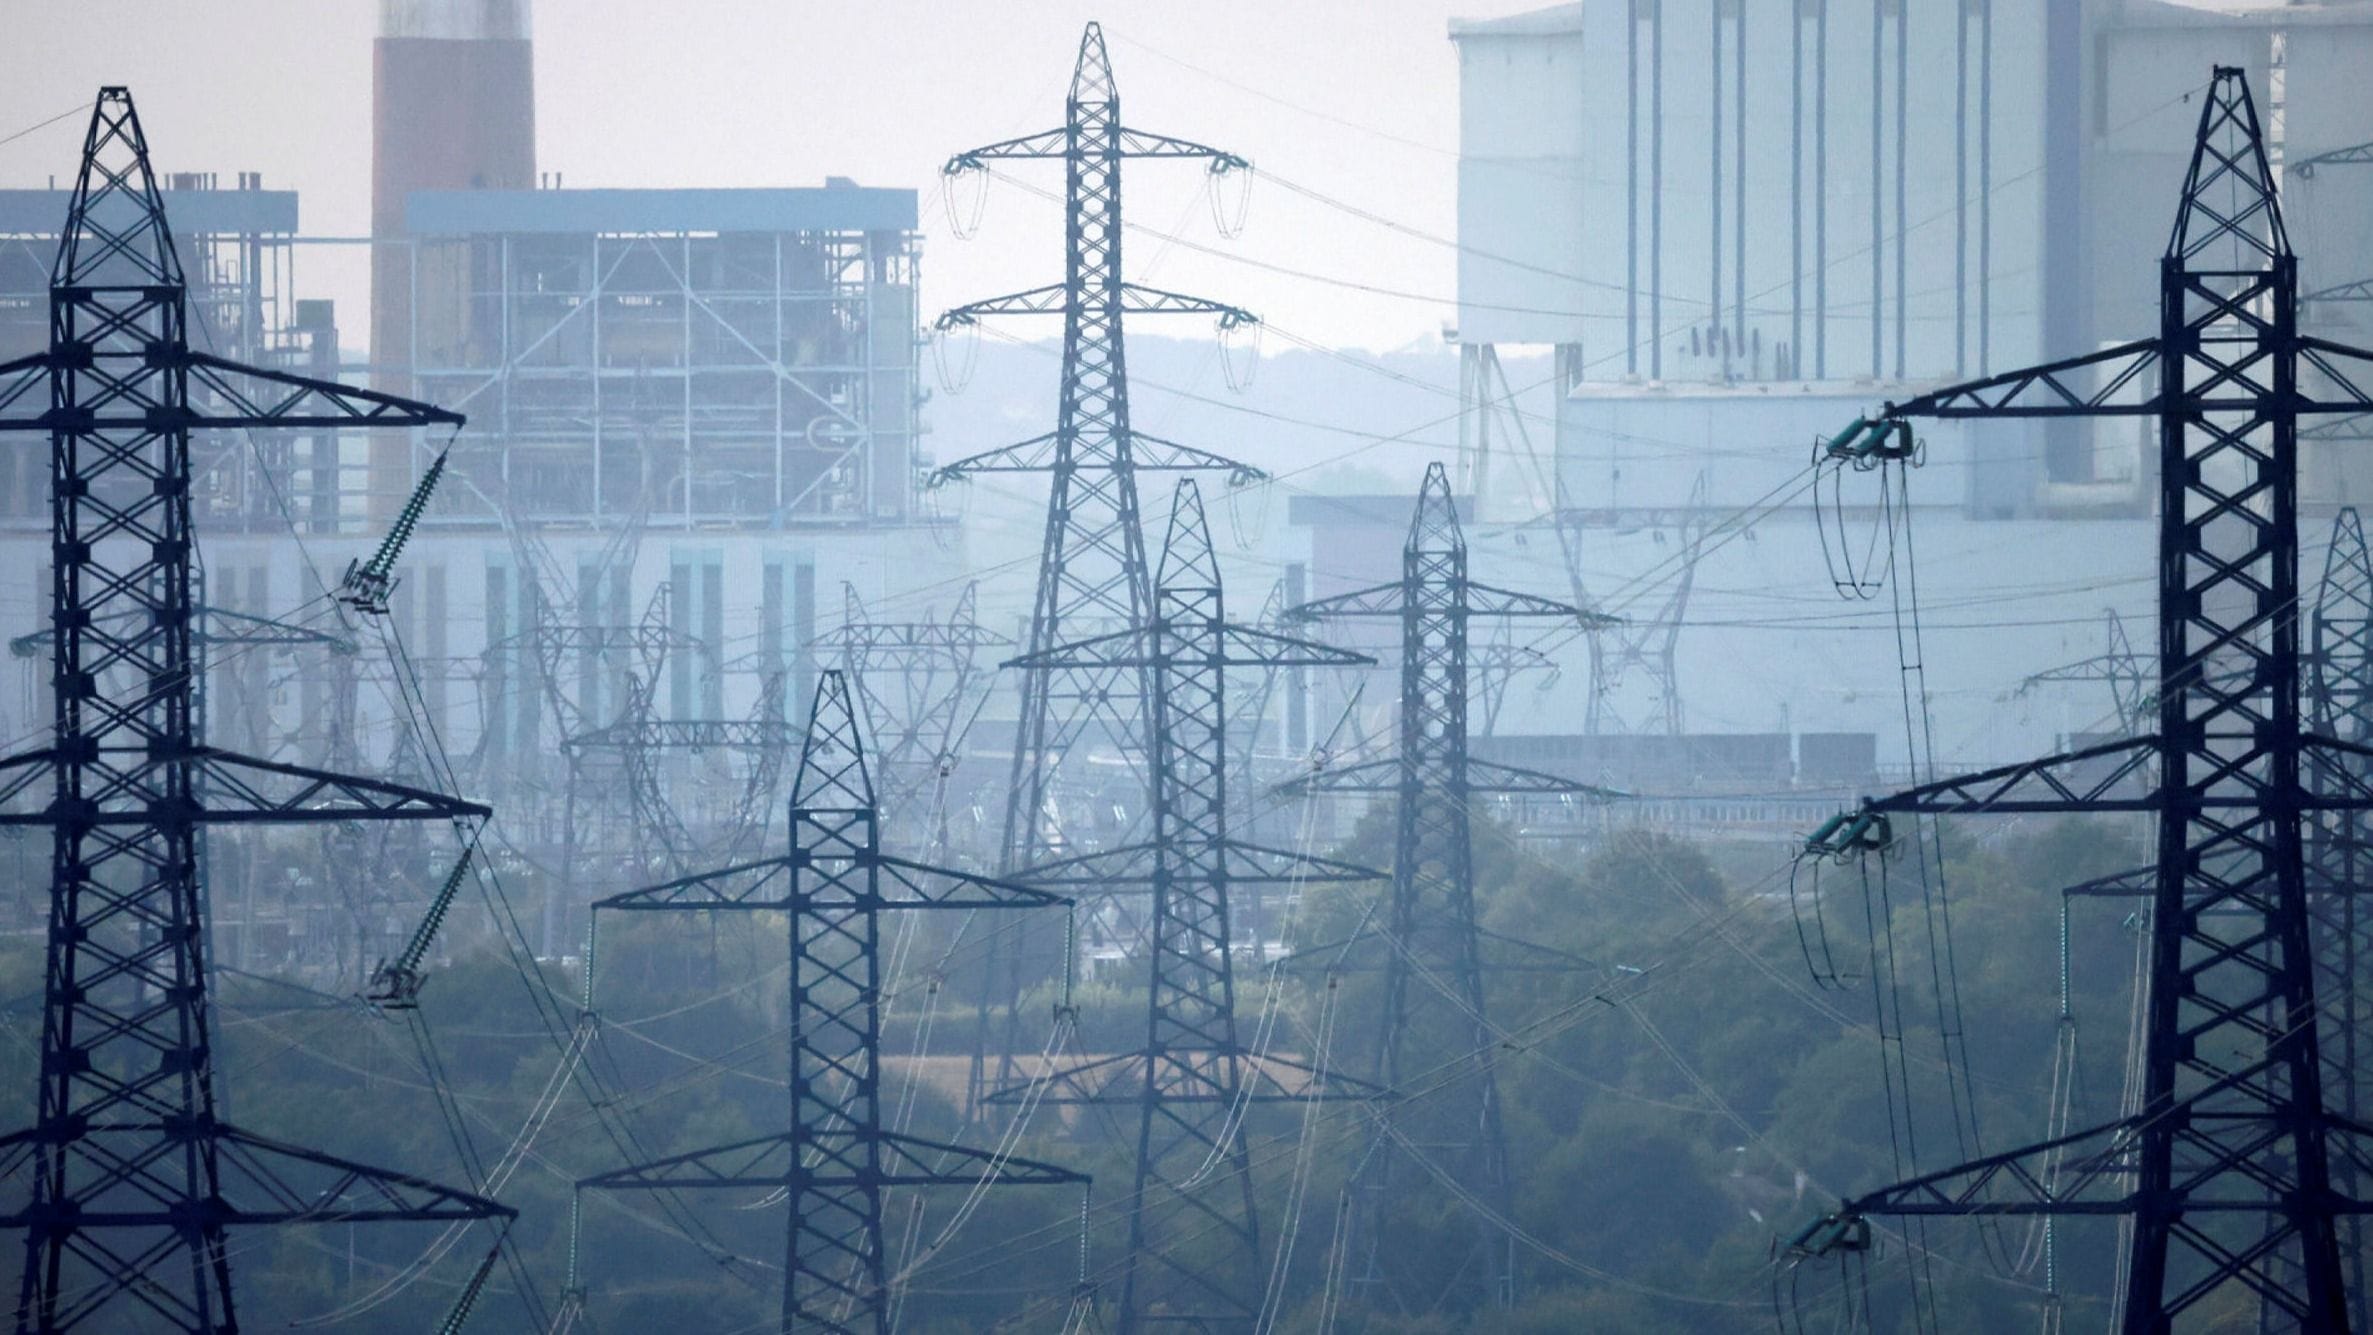
| Energy prices are climbing around the world amid a perfect storm of extreme weather, rising power demand, and supply constraints. It’s roiling markets overseas, with China and India facing electricity crises while a dozen power companies in the UK have gone belly-up.
Driving the news: Oil prices jumped again last week after OPEC decided not to boost production beyond the modest increase that it had previously outlined. Prices for both oil and natural gas have roughly doubled over the last year, and gasoline at US pumps is up by about 50% on average. Why it matters: Commodities like oil and gas operate in global markets, so no economy is immune to the effects of rising prices. Just look at the Consumer Price Index — its latest reading in September showed energy costs up 25% compared to a year ago. The big picture: Higher energy costs impact our economic recovery. Every dollar that goes to electric and heating bills is a dollar that isn’t spent on holiday shopping or going out to eat. Luckily in Australia, we are heading into Summer, but in the Northern Hemisphere, it is feared that prices may go up further, making for a chilly winter. Bank of America analysts estimate Brent crude oil could hit $100 per barrel — a price not seen since 2014. The story: The current price trajectory is the result of supply moderating while demand heads skyward. On the demand side, the reopening of the global economy over the last year sent energy needs up around the world. High demand led to natural gas shortages in Europe and China. This prompted some power companies to swap gas for oil — pushing up prices of both. The supply side is more complicated. Firstly, oil production dropped off at the start of the pandemic when demand flatlined for everything from aeroplane fuel to petrol. OPEC isn’t raising supply significantly in a bid to keep prices at profitable levels. And, production has been more constrained because the world’s largest economies have made transitioning to more renewable power a top priority. The impact: All these different moving pieces took US energy production down by about 2 million barrels a day over the course of the last year, at a time when demand has surged based on the global reopening trade. Our view: The effect of oil companies refusing to raise output in response to higher demand is functionally a carbon tax by another name. The longer fossil fuels remain pricey; the more attractive the development of renewable alternatives will be. Based on today’s announcement that Prime Minister Scott Morrison will attend Cop26 in Glasgow next month, we wait with anticipation to see what commitment our country will make regarding this complicated landscape.
|
|
| On a different note, some quick housekeeping updates.
Super stapling Firstly, super stapling comes into effect on 1 November 2021. This reform will see your super ‘stapled’ to you as you move from job to job (currently, if you do not nominate a super fund, one is opened for you in the employer’s default fund). The change is designed to reduce the prevalence of unintended multiple superannuation accounts and their associated fee duplication. Once “stapling” comes into force, the onus will be on employers to identify a new employee’s superannuation account. The Australian Tax Office is developing a system to automate this process. It is expected to be ready in mid-2022. By being stapled to a super fund does not mean locking yourself into that particular fund. It is important that everyone review their super from time to time and particularly as circumstances change. Changes to income protection cover From 1 October 2021, insurers will offer income protection policies with the following changes:
Despite the quality of income protection policies declining, initial observations from insurers who moved early on these changes indicate no material decline in the premiums when compared to the current income protection policies on offer i.e. as current prices based on benefits available are creating unsustainable losses for insurers. We are, however, hopeful that the new regime won’t see the accelerated premiums we have seen over the last couple of years. If you do not already have income protection cover in place, below are additional important considerations:
|
|
Stay safe and look after one another. As always, if you have any concerns or questions at any time, please reach out to your FinSec adviser. |
|
|
| We have enjoyed receiving much positive feedback in relation to this publication. Many have asked if they can share with family and friends and we would be delighted if you did! To ensure the integrity of the links please forward via the ‘send to a friend’ link at the very bottom of this email. |